Debt Relief:Primary Research Results: Difference between revisions
No edit summary |
|||
| (13 intermediate revisions by 2 users not shown) | |||
| Line 1: | Line 1: | ||
[[Image:race.jpg|thumb|Race Comparison]]Attending college or any other higher educational institution can often be a trying time for a student, financially speaking. The aim of this simulated survey was to track and analyze the financial condition, attitudes and habits of the average student. Therefore, the information gathered from this survey, in conjunction with the rest of the research composed on this site, is to be used to help to students-or anyone else for that matter-who find themselves in or facing large amounts of debt. | |||
[[Image:gender.jpg|thumb|Gender Comparison]]This information is of a simulated proximity survey administered at Macon State College during the Fall 2004 semester. The data was gathered from a class of fourteen students and the data was replicated eight times for a total of 112 samples. To validate this survey we based the questions of race, ethnicity and age on the Macon State College characteristics from the Fall 2003 semester. | |||
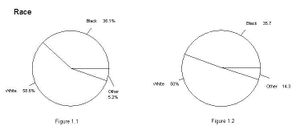
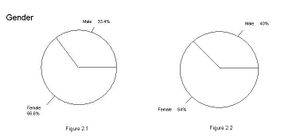
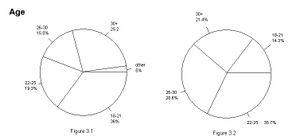
The pie charts to the side represent the percent difference between the characteristics we used as validation. The charts allow the viewer to make direct comparisons between the results of our simulated data to that of Macon States actual statistics. The Macon State statistics are represented by Figures 1.1, 2.1 and 3.1 while our survey data is represented by Figures 1.2, 2.2 and 3.2. | |||
[[Image:age.jpg|thumb|Age Comparison]]There is a noticeable discrepancy between figures of age distribution. The sample of students that the survey was based on was taken from a night class. Due to the fact that evening classes are typically populated by students of higher age, we expected this discrepancy. For this simulated survey, we felt that the difference between the was percentages was within acceptable limits to complete our research. | |||
Our | Our complete survey data may be viewed as a [http://litmuse.maconstate.edu/docs/3106/debt_research.pdf PDF]. | ||
---- | |||
[[Debt Relief | Debt Relief Home Page]] | |||
Latest revision as of 14:31, 15 December 2004
Attending college or any other higher educational institution can often be a trying time for a student, financially speaking. The aim of this simulated survey was to track and analyze the financial condition, attitudes and habits of the average student. Therefore, the information gathered from this survey, in conjunction with the rest of the research composed on this site, is to be used to help to students-or anyone else for that matter-who find themselves in or facing large amounts of debt.
This information is of a simulated proximity survey administered at Macon State College during the Fall 2004 semester. The data was gathered from a class of fourteen students and the data was replicated eight times for a total of 112 samples. To validate this survey we based the questions of race, ethnicity and age on the Macon State College characteristics from the Fall 2003 semester.
The pie charts to the side represent the percent difference between the characteristics we used as validation. The charts allow the viewer to make direct comparisons between the results of our simulated data to that of Macon States actual statistics. The Macon State statistics are represented by Figures 1.1, 2.1 and 3.1 while our survey data is represented by Figures 1.2, 2.2 and 3.2.
There is a noticeable discrepancy between figures of age distribution. The sample of students that the survey was based on was taken from a night class. Due to the fact that evening classes are typically populated by students of higher age, we expected this discrepancy. For this simulated survey, we felt that the difference between the was percentages was within acceptable limits to complete our research.
Our complete survey data may be viewed as a PDF.


